-
Water Grid
Storage Capacity0Capacity83.5%
Change-0.2%
last 7 days
-
Catchment Average
Rainfall
 Rainfall
17.8mm
-
Average
Daily UsageAvg Person156L
Change-6L
last month
-
Water Grid
Storage Capacity0Capacity83.5%
Change-0.2%
last 7 days
-
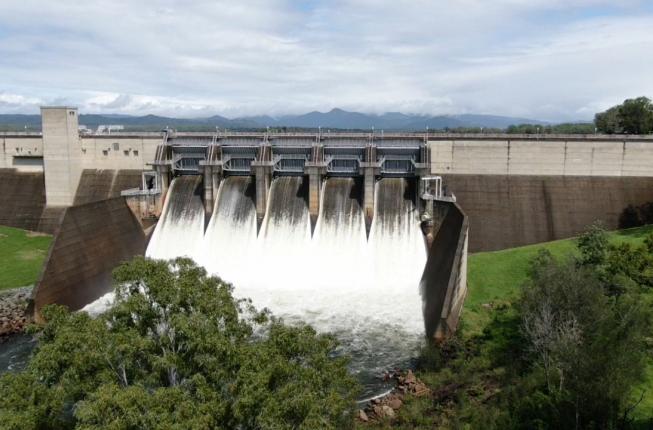
DAM LEVELS as at 6:00pm, 7 May 2024
The following table provides the latest available information about the region's dams.
Dam levels are updated regularly 24 hours a day. Please note: dam levels are based on automated data which has not been verified.
Click here for updates on gated dam operations and spilling un-gated dams, or sign up for our free Dam Release Notification Service to receive alerts by email, SMS or recorded message to landline, as spilling or gated releases occur.
For information about flood levels, contact your local Council. For information about road impacts, contact Transport and Main Roads. For information about river levels, please see the Bureau of Meteorology website.
Dam Full supply volume (ML) Current volume (ML) % full Latest observation Comment Atkinson
View historical dam levels30, 401 ML 25, 118 ML 82.6% 5:00pm 07/05/2024 Baroon Pocket
View historical dam levels61, 000 ML 61, 208 ML 100.3% 6:00pm 07/05/2024 Dam is spilling Bill Gunn (Lake Dyer)
View historical dam levels6, 947 ML 6, 856 ML 98.7% 5:02pm 07/05/2024 Borumba
View historical dam levels46, 000 ML 46, 125 ML 100.3% 6:00pm 07/05/2024 Dam is spilling Cedar Pocket
View historical dam levels735 ML 741 ML 100.8% 6:00pm 07/05/2024 Dam is spilling Clarendon
View historical dam levels24, 276 ML 15, 933 ML 65.6% 4:37pm 07/05/2024 Cooloolabin
View historical dam levels8, 183 ML 8, 162 ML 99.7% 5:00pm 07/05/2024 Enoggera
View historical dam levels4, 262 ML 4, 282 ML 100.5% 4:35pm 07/05/2024 Dam is spilling Ewen Maddock
View historical dam levels16, 587 ML 16, 748 ML 101.0% 5:00pm 07/05/2024 Dam is spilling Gold Creek
View historical dam levels801 ML 815 ML 101.8% 5:00pm 07/05/2024 Dam is spilling Hinze
View historical dam levels310, 730 ML 311, 686 ML 100.3% 6:00pm 07/05/2024 Dam is spilling Lake Macdonald (Six Mile Creek)
View historical dam levels8, 018 ML 8, 252 ML 102.9% 6:00pm 07/05/2024 Dam is spilling Lake Manchester
View historical dam levels26, 217 ML 26, 193 ML 99.9% 5:00pm 07/05/2024 Leslie Harrison
View historical dam levels13, 206 ML 13, 194 ML 99.9% 5:00pm 07/05/2024 Little Nerang
View historical dam levels6, 705 ML 6, 745 ML 100.6% 5:31pm 07/05/2024 Dam is spilling Maroon
View historical dam levels44, 319 ML 44, 366 ML 100.1% 5:00pm 07/05/2024 Dam is spilling Moogerah
View historical dam levels83, 765 ML 83, 029 ML 99.1% 5:00pm 07/05/2024 Nindooinbah
View historical dam levels213 ML 212 ML 99.4% 4:30pm 07/05/2024 North Pine (Lake Samsonvale)
View historical dam levels214, 302 ML 144, 116 ML 67.2% 6:00pm 07/05/2024 Poona
View historical dam levels655 ML 491 ML 74.9% 4:06pm 07/05/2024 Sideling Creek (Lake Kurwongbah)
View historical dam levels14, 192 ML 14, 266 ML 100.5% 6:00pm 07/05/2024 Dam is spilling Somerset
View historical dam levels379, 849 ML 300, 651 ML 79.2% 3:39pm 07/05/2024 Wappa
View historical dam levels4, 694 ML 4, 731 ML 100.8% 3:53pm 07/05/2024 Dam is spilling Wivenhoe
View historical dam levels1, 165, 240 ML 950, 604 ML 81.6% 5:30pm 07/05/2024 Wyaralong
View historical dam levels102, 883 ML 102, 750 ML 99.9% 5:00pm 07/05/2024 -
82.6%
-
100.3%Dam is spilling
-
98.7%
-
100.3%Dam is spilling
-
100.8%Dam is spilling
-
65.6%
-
99.7%
-
100.5%Dam is spilling
-
101.0%Dam is spilling
-
101.8%Dam is spilling
-
100.3%Dam is spilling
-
102.9%Dam is spilling
-
99.9%
-
99.9%
-
100.6%Dam is spilling
-
100.1%Dam is spilling
-
99.1%
-
99.4%
-
67.2%
-
74.9%
-
100.5%Dam is spilling
-
79.2%
-
100.8%Dam is spilling
-
81.6%
-
99.9%
Note: Full supply capacity does not include the entire flood storage compartments of Wivenhoe and Somerset dams.
The current flood storage capacity -
-
Catchment Average
Rainfall
Rainfall17.8mm
-
RAINFALL as at Tuesday, 7 May 2024
The rainfall values reported below are the catchment average rainfall values recorded across Seqwater’s dam catchments, over a 7 day rolling period.
Rainfall values are updated daily.
Please note: rainfall values are based on automated data which has not been verified.
Dam Current drinking
water volume (ML)% full Change in volume
past 7 days (%)Catchment average rainfall
past 7 days (mm)Baroon Pocket 61, 208 ML 100.3% -0.1 27.9 Cooloolabin 8, 162 ML 99.7% -0.1 29.1 Ewen Maddock 16, 748 ML 101.0% -0.8 26.9 Hinze 311, 686 ML 100.3% -0.4 19.4 Lake Macdonald (Six Mile Creek) 8, 252 ML 102.9% -0.2 32.1 Leslie Harrison 13, 194 ML 99.9% +0.1 6.4 Little Nerang 6, 745 ML 100.6% +0.4 19.4 North Pine (Lake Samsonvale) 144, 116 ML 67.2% 0.0 14.5 Sideling Creek (Lake Kurwongbah) 14, 266 ML 100.5% -0.1 6.3 Somerset 300, 651 ML 79.2% -0.6 11.5 Wappa 4, 731 ML 100.8% -0.2 29.1 Wivenhoe 950, 604 ML 81.6% -0.3 3.6 -
Average
Daily UsageAvg Person156L
Change-6L
last month
-
USAGE as at Wednesday, 24 April 2024
Average residential usage information is updated monthly. Consumption data is published on the first Wednesday of every month.
Water consumption summary for the 28 day period ending Wednesday, 27 March 2024
Zone Daily Production (ML) Daily Per Capita Consumption (L/p/d) Total Rainfall (mm) Average Max Daily Temperature (°C) SEQ Service Provider Monthly LPD Report 886 162 City of Gold Coast 179 179 157.6 27.6 Logan City Council 71 161 114.1 29.9 Redland City Council 39 188 226.0 27.4 Unitywater 181 150 332.2 27.8 Urban Utilities 417 159 139.2 28.5 Residential water consumption for similar time last year (28 day period ending 29 March 2023)
Zone SEQ City of Gold Coast Logan City Council Redland City Council Unitywater Urban Utilities Average daily residential consumption (L/person) 172 188 169 204 161 169